library(tidyverse)Kosmisk Floræ
Generative Art
Generative aRt
R
Or:
- Cosmic Florae
- Flores Cosmiques
- Kosmische Florae
Based on the butterfly curve, defined, in polar coordinates, by:
\[ r = \exp^{\sin\theta} - 2\cos(4\theta) + 5 \sin^5(\frac{2\theta - \pi}{24}) \] Let’s write a function for that:
calc <- function(theta){
  exp(sin(theta)) - 2*cos(4*theta) + sin((2*theta - pi ) /24)^5
}
Prepping data for plot:
A <- seq(0,12*pi, 0.1)
r <-  calc(A)
B <- seq(0,12*pi, 2.1*pi)
C <- lapply(B, function(x) A - x) %>%  unlist()
A contains a sequence of numbers from 0 to 12 times pi. In r we have the matching coordinates. Together they give us the butterfly curve. B is a shorter sequence of numbers. And in C we subtract each value in B from all values in A. The last two lines basically rotates the curve.
Now we plot:
tibble(theta = C, r = rep(r, times = length(C)/length(r))) %>%
    ggplot(aes(x=theta, y = r, color = r, alpha = 0.0001)) +
  geom_point() +
  coord_polar() +
  theme_void()+
  theme(legend.position = "none",
        plot.background = element_rect(fill = "black")) +
  scale_color_gradientn(colours  = c("red", "blue", "green"))
  ggsave("Kosmisk_Floræ-1.png")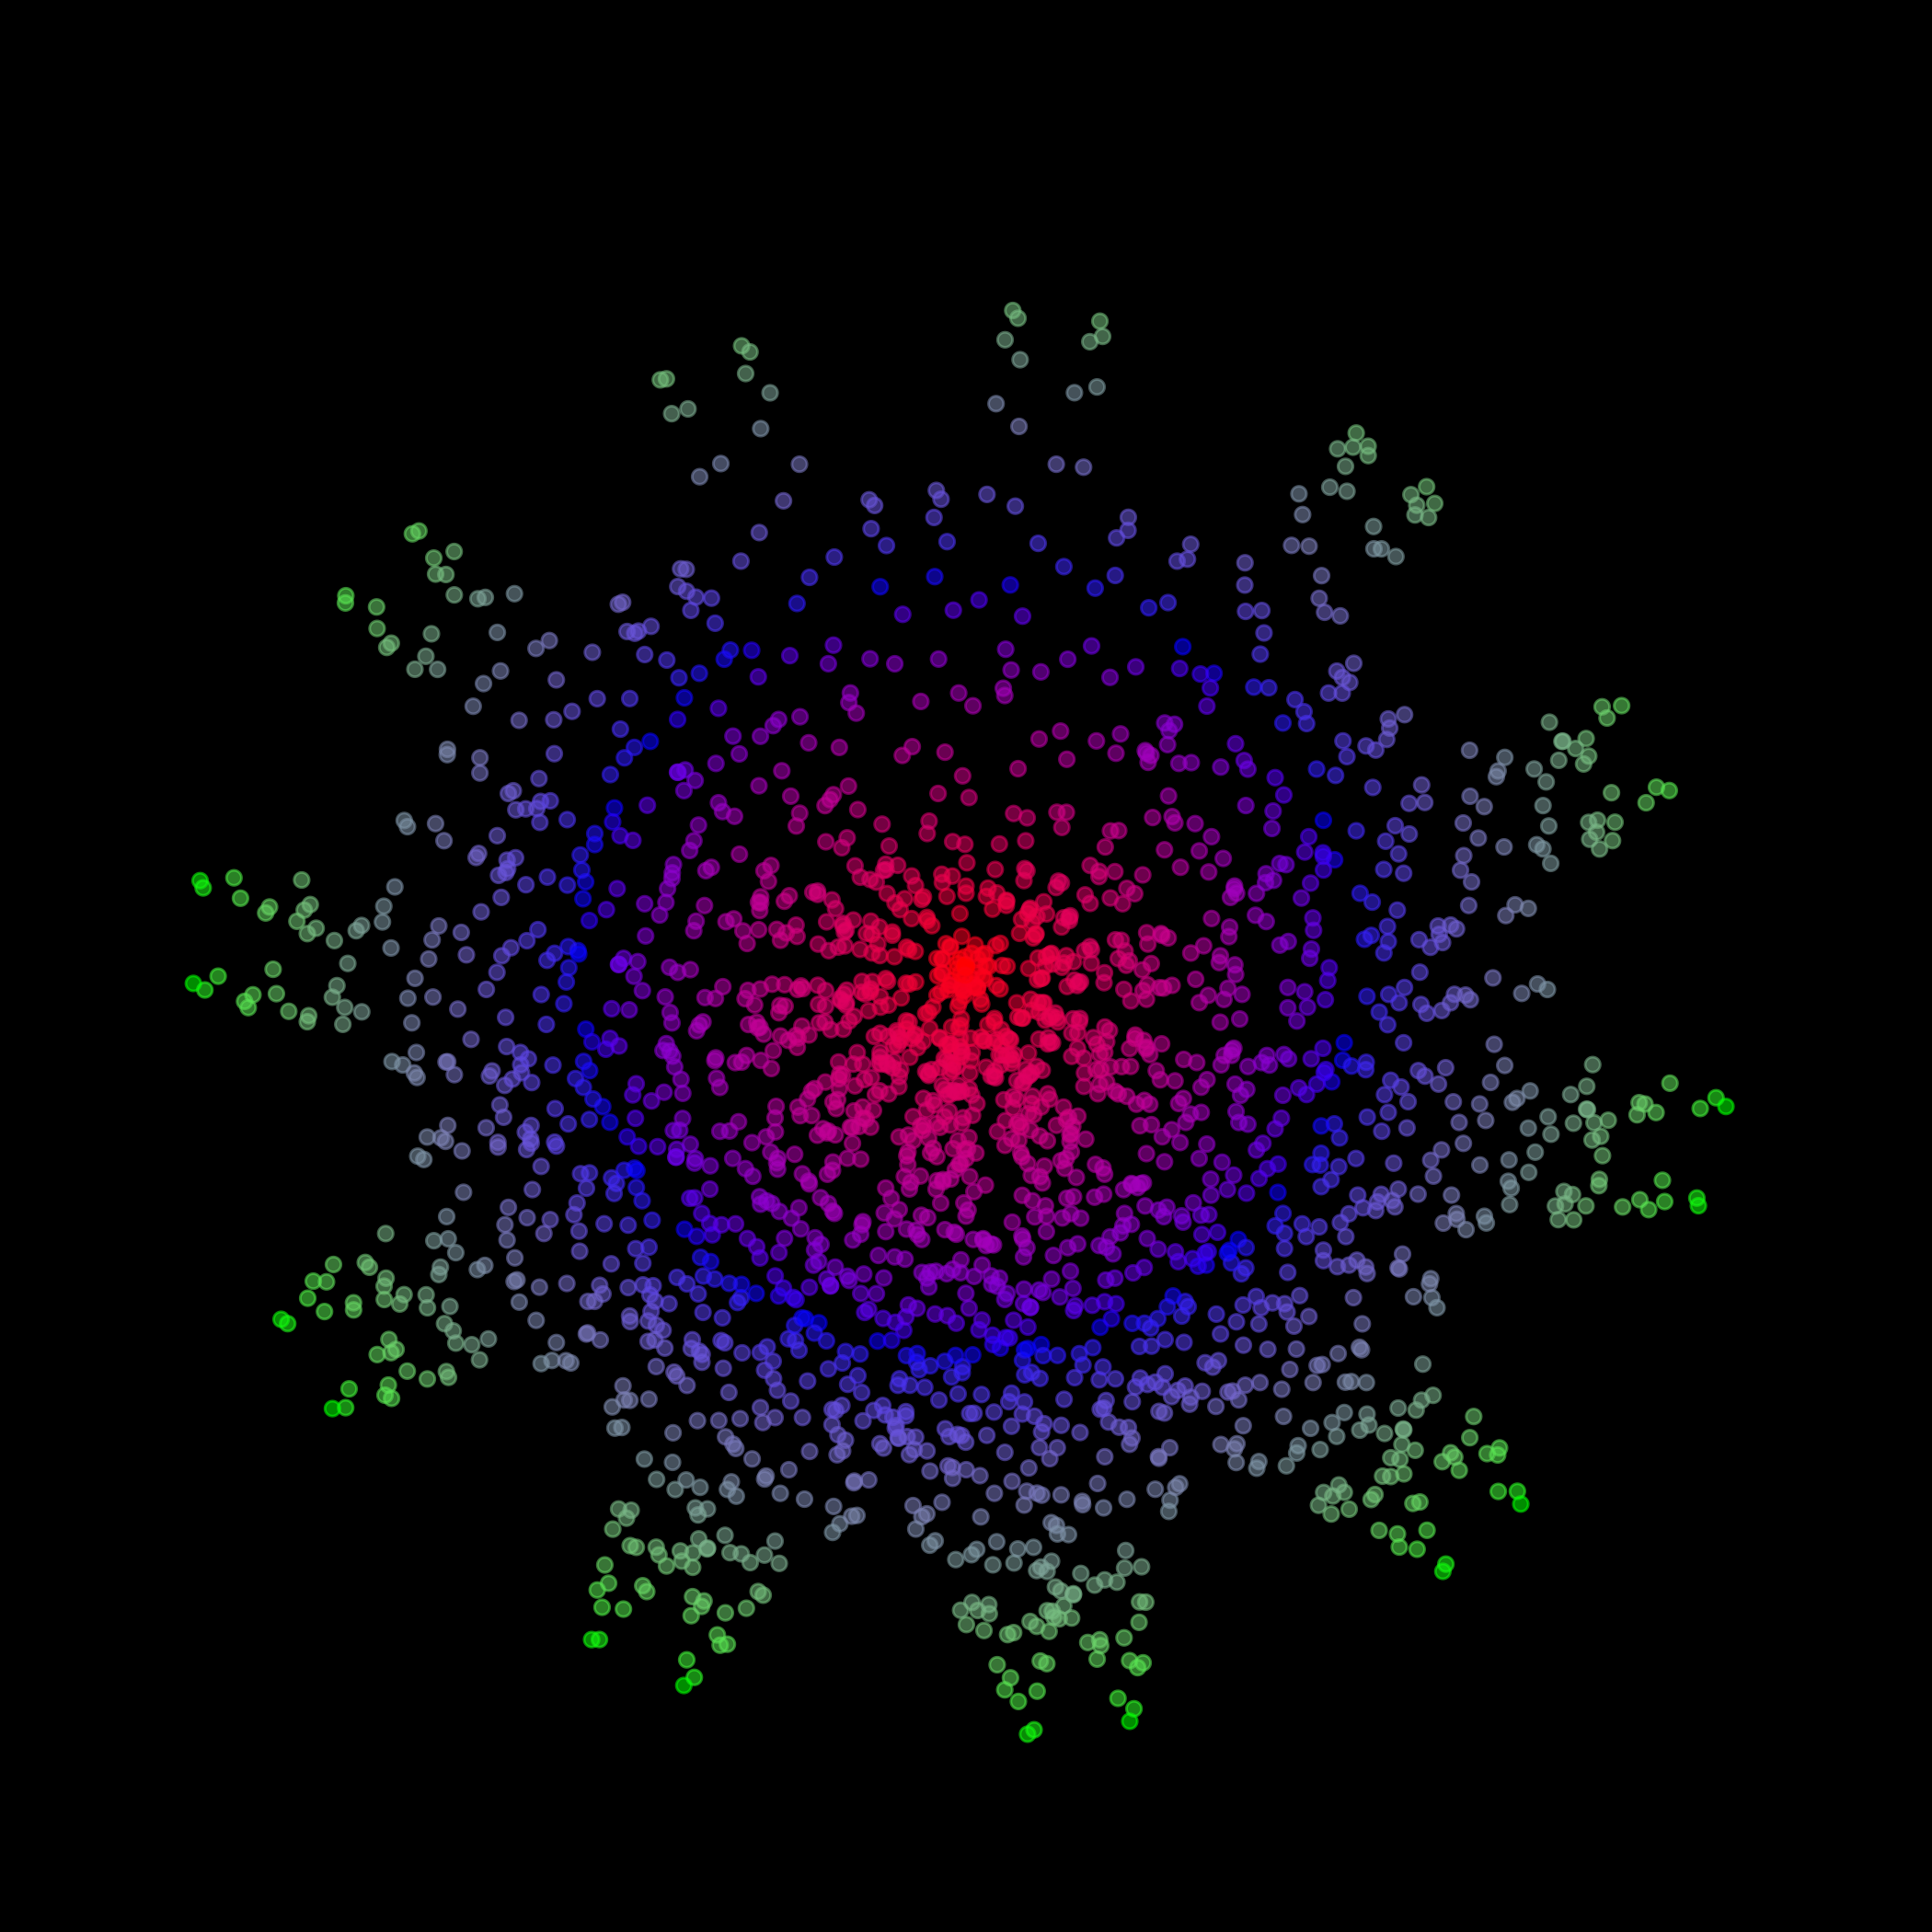
Nice