library(tidyverse)
library(ggforce)CiRcle aRt 0.5
Inspireret af Karel Novosad
Generative aRt
Inspireret af et tryk af Karel Novosad, som jeg så i et vindue i Hamborg.
Et antal rette linier, kombineret med cirkler - i tre farver på en sort baggrund.
Der skal bruges et par biblioteker.
Vi skal bruge en funktion til at placere cirkler:
circles <- function(n = 3, seed = NULL) {
  set.seed(seed)
  z <- seq(1, 3, 0.25)
  x0 <- sample(z, n, replace  =TRUE)
  y0 <- sample(z, n, replace = TRUE)
  r <-  sample(c(0.25, 1, 0.25), n, replace = TRUE)
  colors <- sample(1:3, n, replace = TRUE) |> factor()
  df <- tibble(x0 = x0, y0 = y0, r = r)

  ggforce::geom_circle(
    data = df,
    mapping = aes(x0 = x0, y0 = y0, r = r, color = colors),
    fill = NA,
    inherit.aes = FALSE
  )
}
Og en funktion til at tilføje linier:
lines <- function(n = 5, seed = NULL){
   z <- seq(1, 3, 0.25)
  x0 <- sample(z, n, replace = TRUE)
  y0 <- sample(z, n, replace = TRUE)
  l <-  sample(c(0.25, 3, 0.25), n, replace = TRUE)
  xy <- sample(c(0,1), n, replace = TRUE)
  dir <- sample(c(-1,1), n, replace = TRUE)
  colors <- sample(1:3, n, replace = TRUE) |> factor()
  tibble(x0 = x0, y0=y0, l = l, x = xy, dir = dir, color = colors) |>
  mutate(y = as.numeric((x == 0))) |>
   mutate(x1 = x0 + x * dir * l,
         y1 = y0 + y * dir * l) |>
    geom_segment(mapping = aes(x = x0, y = y0, xend = x1, yend = y1, color = colors), inherit.aes = FALSE)

}
Og så kombinerer vi dem. 5 cirkler, 11 linier:
ggplot() +
  circles(n = 5, seed = 666) +
  lines(n = 11, seed = 666) +
  coord_cartesian(xlim = c(0,4), ylim = c(0,4))  +
  theme_void()+
  theme(legend.position = "none",
        plot.background = element_rect(color = "black",
        fill = "black")) +
  annotate("text", x = 3.5, y = -0.1,
            size = 3,
            label = "seed = 666",
            color = "white")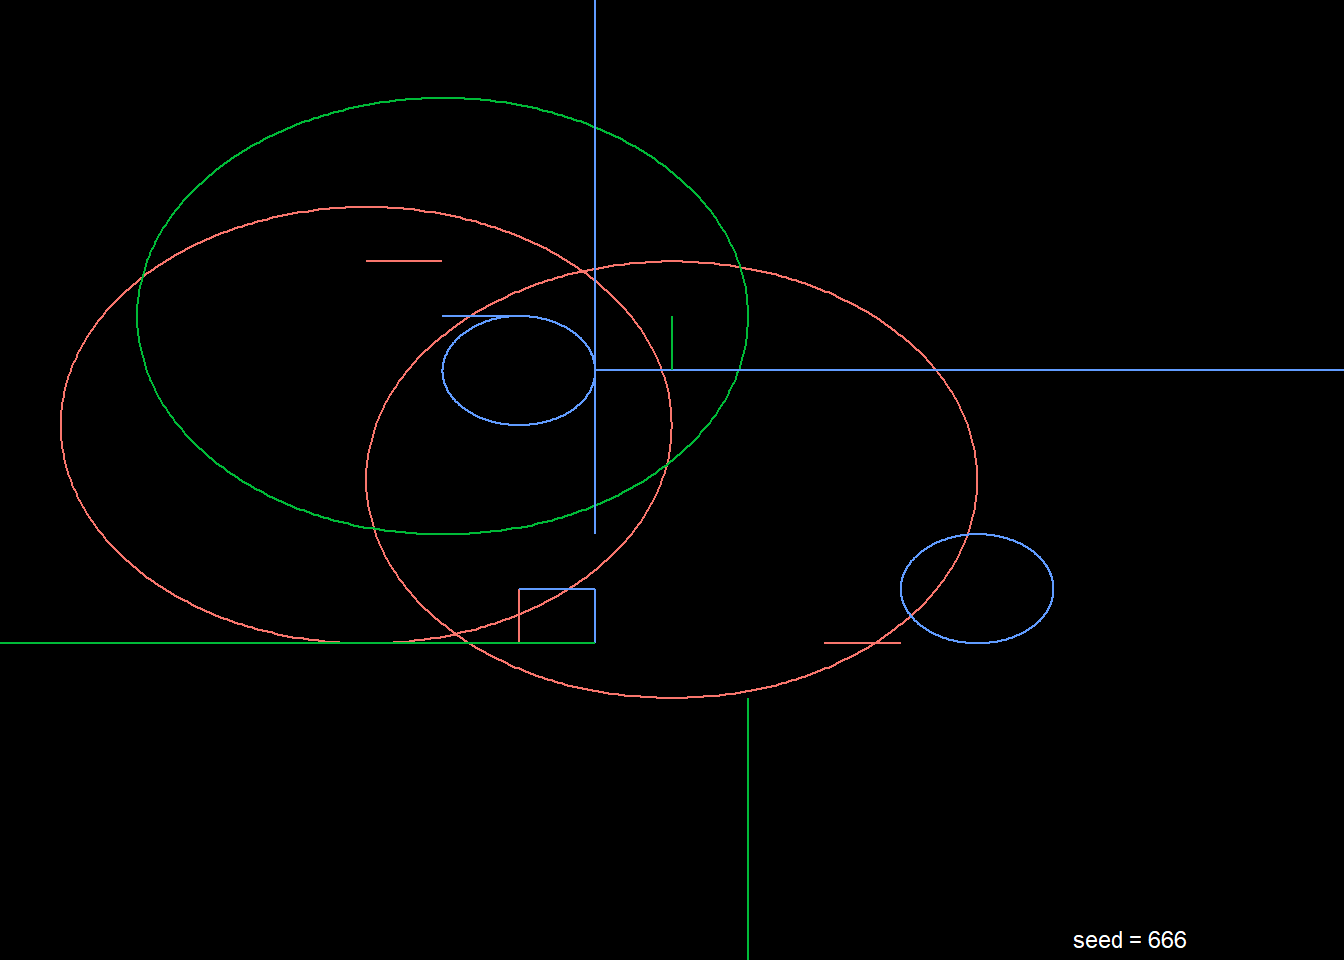
Det skal nok refaktoriseres, bruge noget andet end default farver osv. Det gemmer vi til version 1.0.